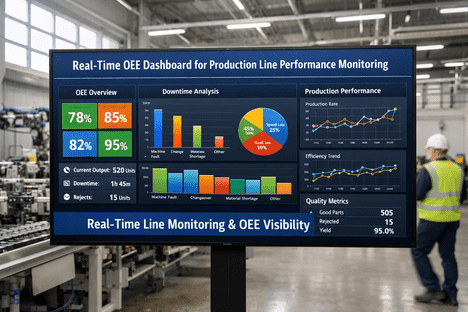
Packaging line OEE is calculated by multiplying Availability, Performance, and Quality. The calculation is simple, but a useful result depends on more than the formula: the team must define planned production time consistently, record every meaningful stop, use a realistic ideal rate, and count rejects accurately.
The goal is not to produce a flattering percentage. A packaging line OEE measure should show where saleable output was lost: long stops, changeovers, repeated short interruptions, slow running, startup waste, or reject events. When the loss definitions change from shift to shift, OEE becomes a reporting exercise rather than an improvement tool.
The packaging line OEE formula
Use the three-factor formula:
OEE = Availability × Performance × Quality
Express each factor as a decimal while calculating, then convert the final result to a percentage.
| Factor | Formula | Main question answered |
|---|---|---|
| Availability | Run Time ÷ Planned Production Time | Was the line available to run? |
| Performance | (Ideal Cycle Time × Total Count) ÷ Run Time | Did it run at its proven target rate? |
| Quality | Good Count ÷ Total Count | How much output was accepted first time? |
At 100% OEE, a line would run for all planned production time, at its defined ideal rate, with no rejects. That is a useful theoretical reference, not a reason to redefine losses until the number reaches a target.
Step 1: Define planned production time before calculating anything
Planned Production Time is the time during which the line was expected to make product. Start with scheduled shift time, then remove only time that the site has formally defined as outside the production opportunity.
Examples often excluded from Planned Production Time include unscheduled plant closure or a meal break that is genuinely outside the production schedule. The exact policy is less important than applying it consistently across products, shifts, and reporting periods.
The most common way to hide packaging line downtime losses is to expand the list of excluded time whenever an inconvenient loss appears. Changeovers, sanitation, planned maintenance, meetings, material shortages, and operator breaks may be treated differently by different factories. Decide the rule in advance, document it, and retain the underlying categories even if a corporate reporting convention excludes some time from OEE.
A practical approach is to report two views when necessary:
- OEE within planned production time: the standard operational measure.
- Schedule and utilization losses: time outside the OEE window, shown separately rather than made invisible.
This preserves comparability while still showing how much calendar capacity is consumed by cleaning, planned maintenance, or other scheduled work.
Step 2: Build a loss tree that assigns every lost minute once
Before relying on a dashboard, create a simple loss tree for the line. Every minute should have one primary status. Every unit should have one disposition: good, reject, or rework according to the site’s defined rule.
A useful packaging loss tree begins with planned production time and separates losses into three branches.
Availability losses: the line was not producing
Availability losses are stops that remove production time from the run window. Typical examples include:
- Equipment breakdowns and fault recovery
- Changeovers, setup, and adjustment
- Waiting for film, trays, cartons, labels, or product
- Utility interruptions
- Downstream blockage or upstream starvation
- Extended cleaning or sanitation performed during the planned production window
- Operator intervention that stops the line
The team must decide how to treat brief stops. A common convention puts longer stops into Availability and captures short, repetitive interruptions in Performance. Set a fixed threshold and do not move events between categories simply because one classification improves the OEE result.
Performance losses: the line ran, but not at the ideal rate
Performance measures output against the ideal cycle time during Run Time. It captures reduced speed and, under the usual convention, frequent small stops that are too short to be coded as Availability downtime.
Examples include:
- A cartoner running below its validated target speed
- Brief jams at an infeed, labeler, checkweigher, or case packer
- Poor product presentation causing intermittent gaps
- Reduced speed to manage unstable film tracking or sealing
- Repeated sensor resets or short clearing actions
- Accumulation conveyor behavior that masks interruptions upstream or downstream
Performance should not be calculated from a nameplate speed that the line cannot sustain in normal production. Use an ideal rate that is technically credible for the product format, pack pattern, material, and line configuration. If the target changes by SKU, maintain an approved rate table by SKU or product family.
Quality losses: the line made output that was not accepted
Quality is based on first-pass good output. Count all units produced in Total Count, then subtract units rejected or otherwise not accepted by the defined quality standard.
For a packaging line, quality losses may include:
- Seal defects or leaking packs
- Incorrect label, code, or date marking
- Underweight or overfill packs where rejected
- Damaged cartons, trays, or cases
- Missing components or incorrect pack count
- Startup product that is not released for sale
Be clear about rework. If a pack is rejected, opened, corrected, and later accepted, the initial failure should normally remain visible in the quality-loss record. Otherwise, the OEE calculation can understate the labor, delay, and material loss associated with the defect.
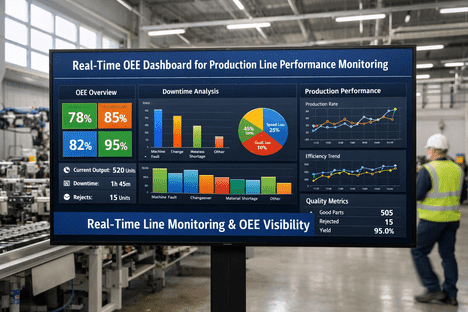
Source: ifactoryapp
Step 3: Collect data that can be checked against reality
Automated signals can improve OEE data collection, but automation does not eliminate classification errors. A line controller may know that a machine stopped; it may not know whether the root cause was a film splice, a missing operator, a blocked discharge, poor incoming cartons, or a fault on another machine.
Use a combination of machine data and operator confirmation:
- Capture line state and timestamps. Record run, stop, fault, idle, and starved or blocked states where the controls architecture supports them.
- Log the reason for meaningful stops. Give operators a short, practical reason-code list, with an option for review when the right code is unclear.
- Collect counts from a defined point. State whether Total Count is measured at the filler discharge, primary packer, cartoner, or finished-case exit. Do not mix count locations.
- Capture rejects by cause and location. Reject signals from checkweighers, vision systems, metal detectors, and manual inspection should reconcile with physical reject bins where possible.
- Review exceptions daily. Look for implausible ideal speeds, negative counts, unusually high rates, extended “unknown” downtime, and stop durations that do not match shift observations.
A useful check is to reconcile good production with production records, rework records, and scrap records. The records will not always match perfectly, but large unexplained gaps are a data problem before they are an OEE problem.
Step 4: Calculate OEE with a worked packaging example
Assume a packaging line has a 480-minute shift. A 30-minute scheduled break is formally excluded from the production window.
- Scheduled shift time: 480 minutes
- Excluded planned break: 30 minutes
- Planned Production Time: 450 minutes
- Availability downtime: 65 minutes
- Run Time: 385 minutes
- Ideal rate: 48 packs per minute
- Total Count: 17,000 packs
- Good Count: 16,660 packs
Availability
Availability = 385 ÷ 450 = 85.6%
Performance
At 48 packs per minute, ideal cycle time is 1 ÷ 48 minute per pack.
Performance = (17,000 ÷ 48) ÷ 385 = 92.0%
Quality
Quality = 16,660 ÷ 17,000 = 98.0%
OEE
OEE = 0.856 × 0.920 × 0.980 = 77.1%
The number alone is not the conclusion. This result indicates that Availability is the largest factor-level opportunity, but the team should then examine the availability loss codes. If most of the 65 lost minutes came from changeover, the work is different from a situation dominated by recurring breakdowns or material shortages.
Step 5: Turn the OEE number into prioritized work
Use the OEE factors to find the branch of the loss tree, then use minutes and lost units to identify the specific problem.
A practical review sequence is:
- Identify the bottleneck or line constraint for the SKU being run.
- Rank losses at that point by lost minutes, lost good packs, and recurrence.
- Separate chronic losses from isolated major events.
- Confirm the loss with operators, maintenance staff, and production records.
- Assign a countermeasure that matches the mechanism of loss.
- Verify whether the loss declined without shifting it to another machine or category.
For example, a long, infrequent failure may warrant reliability analysis, spare-parts review, or a maintenance task change. Repeated short carton jams may require adjustment standards, better incoming material specifications, guide-rail setup, sensor checks, or a change in carton handling. A slow but stable line may need a validated operating-rate review rather than pressure on operators to run faster.
Focus on the constraint first. Improving OEE on a non-bottleneck machine can create more accumulation or queues without increasing finished output.
Why maximum utilization is not always the answer
OEE measures effectiveness within a defined production window; it is not a universal instruction to keep every machine running continuously. A packaging line is a connected system. Running an upstream machine at maximum speed when the downstream packer, case packer, or palletizing area cannot absorb output creates accumulation, blocked conditions, handling damage, and unstable restart behavior.
High utilization can also make changeovers and maintenance harder to schedule, leaving no recovery time for small disturbances. The result may be more queues and less predictable throughput.
Use OEE alongside line throughput, schedule adherence, changeover duration, queue behavior, and service level. The right objective is stable flow of good finished product through the constraint, not the highest apparent activity level at every asset.
Common packaging line OEE mistakes
Counting only breakdowns as downtime
This makes Availability look better but excludes real lost production opportunity. Record changeovers, material waits, cleaning performed during production time, and operational stops according to the same policy.
Changing the ideal rate to match current performance
Lowering the ideal speed after a difficult shift makes Performance improve on paper. Review ideal rates through a controlled engineering process, with product-specific standards where needed.
Ignoring minor stops
Small interruptions can be a major loss on high-speed packaging equipment. If individual events are too brief for manual coding, use machine data, event counters, or focused observation to establish the pattern.
Measuring one machine while calling it line OEE
A filler, cartoner, and case packer may each report different rates and stop conditions. Define the line boundary and count point, then distinguish machine OEE from the output of the complete packaging system.
Treating “unknown” as a permanent reason code
Unknown time is useful temporarily, but it should trigger investigation. Excessive unknown downtime means the loss tree is incomplete, the data capture is unreliable, or operators need a simpler way to record causes.
A practical weekly OEE review checklist
- Is Planned Production Time defined consistently for every shift?
- Did every major stop receive a reason code?
- Are short-stop rules consistent across the line?
- Is the ideal rate valid for the SKU and packaging format?
- Do total count, good count, rejects, scrap, and rework broadly reconcile?
- Which loss at the actual constraint caused the most lost good output?
- Did an improvement reduce the loss rather than move it elsewhere?
A credible packaging line OEE program makes losses visible before it tries to improve the score. When the time base, count points, ideal rates, and reason codes are stable, Availability, Performance, and Quality become a practical way to direct maintenance, operations, engineering, and quality work toward the output losses that matter most.
References
- How to Calculate OEE: Formula, Examples, and Honest Limitations. (n.d.). https://reliamag.com/guides/how-to-calculate-oee
- What Is OEE in Manufacturing? Definition, Formula & Improvement Guide. (n.d.). https://www.intelycx.com/resources/what-is-oee-in-manufacturing
- OEE Optimization for Food Production Lines: A Practical Guide. (n.d.). https://oxmaint.com/industries/food-manufacturing/oee-optimization-food-production-lines-practical-guide
- Why OEE Matters in Food Processing. (n.d.). https://www.velecsystems.com/en/why-oee-matters-in-food-processing
- How to calculate OEE (Overall Equipment Effectiveness): A practical guide. (n.d.). https://www.packworld.com/trends/operational-excellence/article/13363857/how-to-calculate-oee-overall-equipment-effectiveness-a-practical-guide
- Improve the production efficiency of your packaging line with OEE. (n.d.). https://en.innovamaquinaria.com/news/how-to-improve-the-production-efficiency-of-your-packaging-line-with-oee
- How to Calculate OEE in Manufacturing Plants: Complete Formula Guide. (n.d.). https://oxmaint.com/industries/manufacturing-plant/how-to-calculate-oee-manufacturing-plants-formula
- OEE in Production: Measurement and Improvement | Tractian. (n.d.). https://tractian.com/en/blog/oee-in-production